
Executive reporting dashboards
Power BI and Excel dashboards for expense monitoring, liquidity review, and executive visibility — built around the numbers leadership actually checks.
Where this started.
A growing operations business was reviewing cash position, receivables, and payables across six disconnected spreadsheets that were rebuilt by hand every month, often disagreeing with each other by the time they reached leadership.
How we worked through it.
- Ran a KPI workshop to cut the tracked metrics from 40+ down to the 12 that actually informed decisions.
- Connected Power BI directly to the accounting export, removing manual copy-paste from the monthly process.
- Built a single liquidity view combining cash, receivables ageing, and payables due within 30/60/90 days.
- Set up automatic monthly refresh so the dashboard is current the morning after books close.
What the delivered work looked like.
A look at the views and outputs built for this engagement.
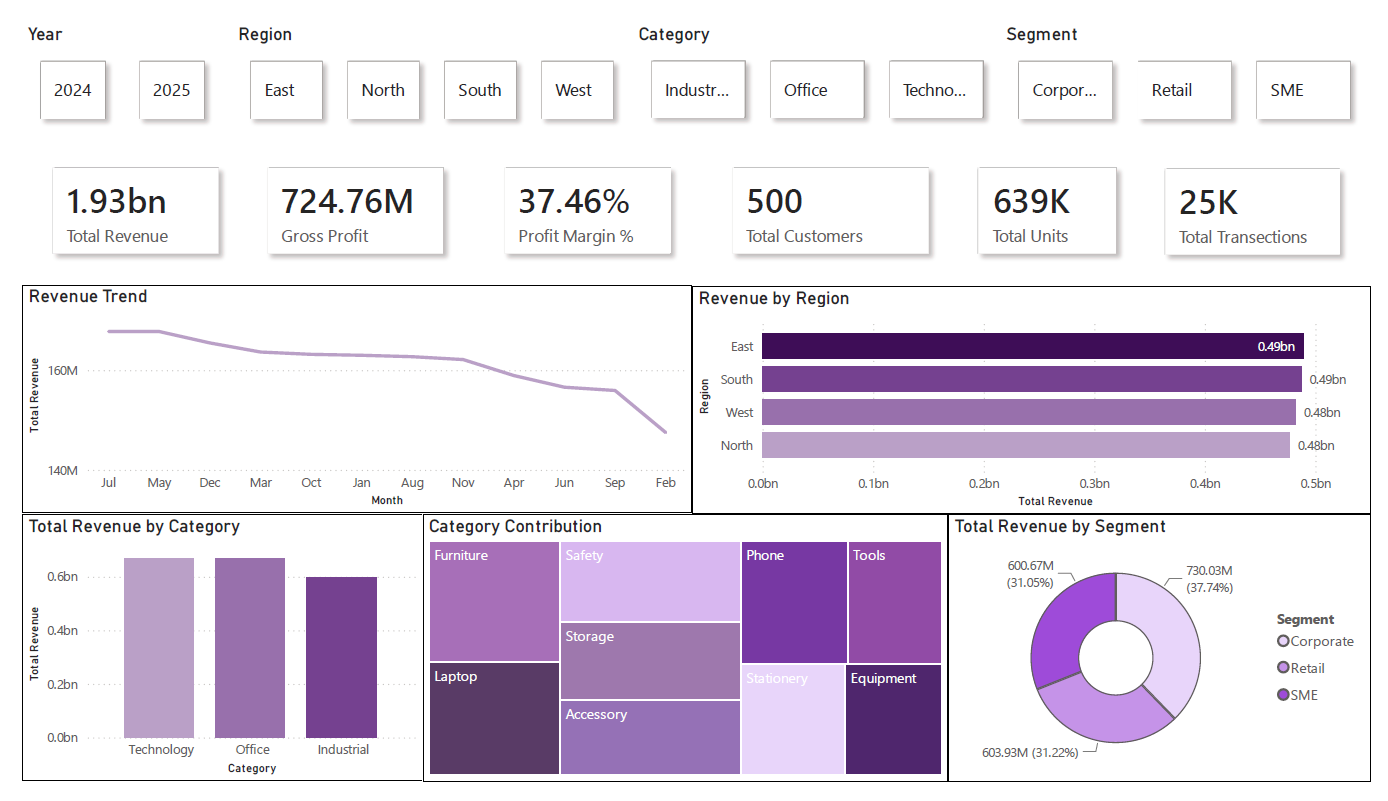
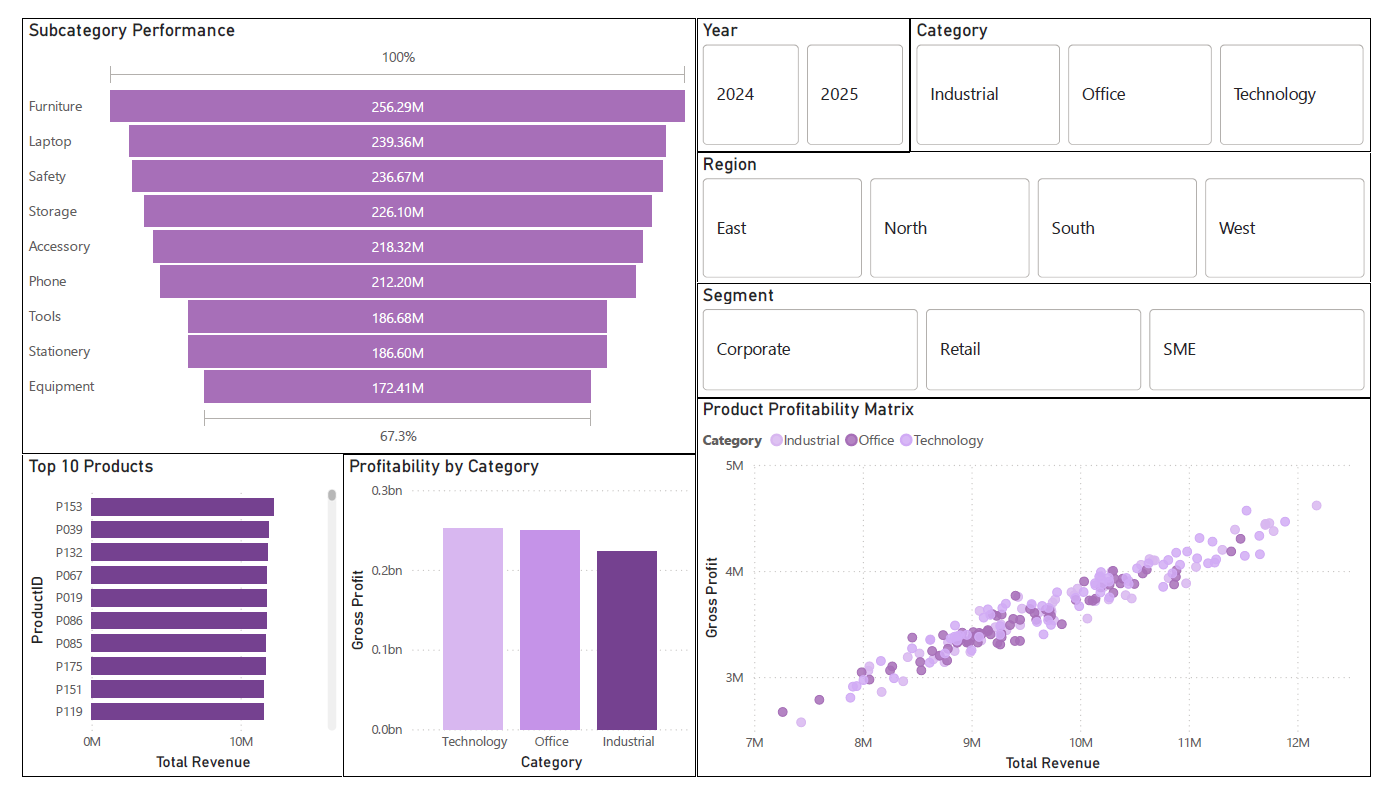
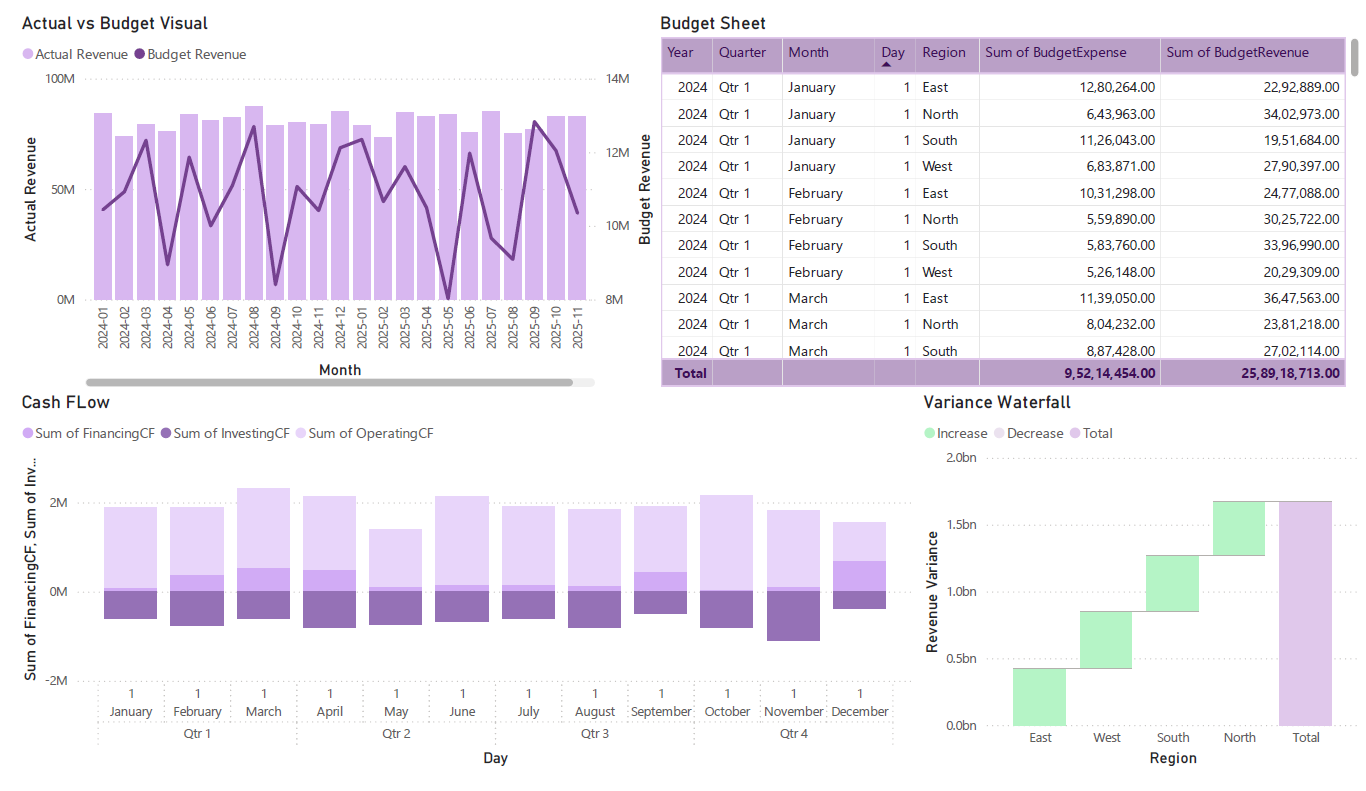
Deliverables from this engagement.
Every file below is a fully worked sample — the same structure and formula logic we apply to live client work, built to demonstrate capability rather than serve as a template to copy.
What the client walked away with.
This workbook and summary are a fully worked sample — built with the same structure, formula logic, and review standard we apply to live client dashboards. All company names and figures shown are fictional demonstration data.
Other categories of work.
Forecast and valuation models
Decision-ready models for business planning, funding discussions, and valuation …
MIS and KPI packs
Structured management reports summarizing financial health, ratios, and working …
Reporting workflow automation
Power Query and advanced Excel systems that improve validation and reconciliatio…